Monitoring
From the Monitoring screen, you can review the status and health of various RadiantOne components for each server. This guide provides an overview of the Monitoring section in Environment Operations Center and its features.
Monitoring is a crucial step in maintaining the health of RadiantOne and it is recommended that you monitor these components on a regular basis.
Getting started
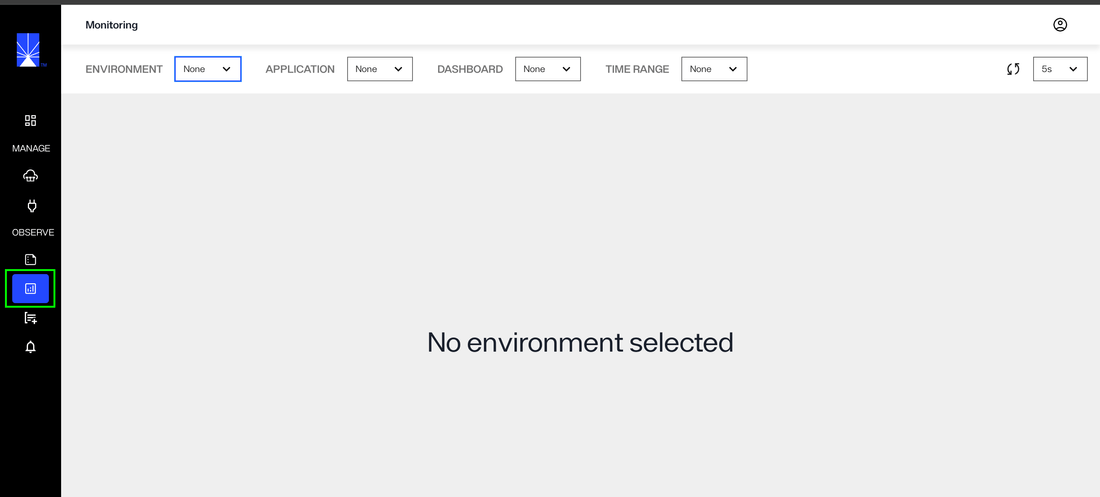
To navigate to the Monitoring screen, select Monitoring (
![]() ) from the left navigation.
) from the left navigation.

Monitor an environment
To generate monitoring metrics, an environment and at least one application must be selected.
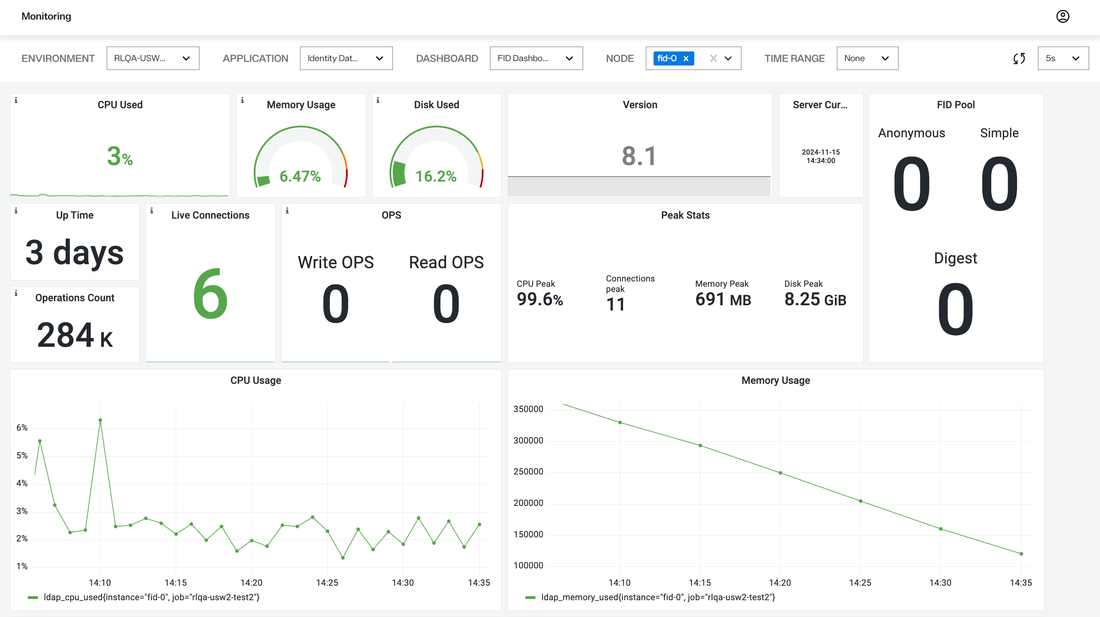
To set the environment, select an environment from the Environment dropdown, an application from the Application dropdown. Select a dashboard from the Dashboard dropdown and one or more nodes from the Node dropdown.
The monitoring dashboard will update to display the component metrics for all nodes selected.

To remove a node, select the "X" associated with the node name.
Filter data by time range
You can filter monitoring data by time range, allowing you to narrow down the targeted data to a specific time frame.
To filter by time, select a range from the Time Range dropdown.
Monitored Metrics for Identity Data Management
The monitoring dashboard displays several node component metrics, allowing you to monitor the health of RadiantOne service.
Component metrics displayed include:
Component | Definition |
|---|---|
CPU Used | Current CPU usage of the machine hosting RadiantOne. |
RAM Usage | JVM memory used. |
Disk Used | Current disk usage of the drive on the machine hosting RadiantOne. |
Version | Current version of RadiantOne installed on the node. |
Server Current | Details about the server you connected to. |
FID Pool | The number of connections in a pool organized by anonymous, digest, and simple. |
Up Time | Time elapsed since the server started. |
Operations Count | How many operations have ben performed on the connection. |
Live Connections | The live number of concurrent connections to RadiantOne FID. |
Ops | The type and number of operations performed. |
Peak Stats | Peak statistics for various components, such as CPU, Connections, Memory, and Disk. |
CPU Usage | A line graph that charts CPU usage over time. |
RAM Usage | A line graph that charts RAM usage over time. |