Update and Monitor Environment Nodes
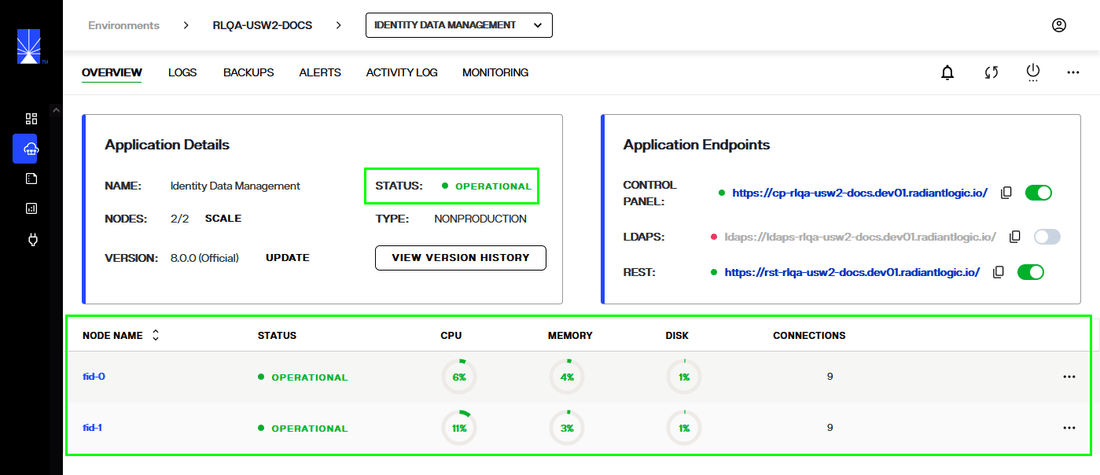
This guide describes how to adjust the number of nodes in an environment and to monitor the status details of a specific node. The Overview tab provides a high-level view of all FID node statuses for quick monitoring of cluster health. Each individual node has a detailed view that provides further information on the status and health of a given node.
Adjust number of nodes
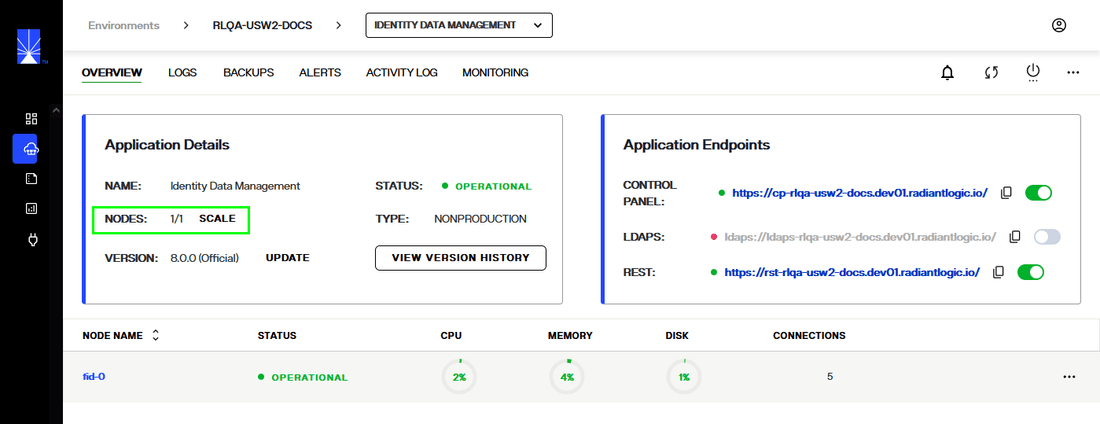
To set the number of FID nodes contained in an environment, select the Scale option under "Application Details"
In the Adjust Environment Scale dialog, use the slider to increase or decrease the quantity. Alternatively, you can select either the minus (-) or plus (+) sign on either side of the slider to increase or decrease the number of FID nodes to display.
By default the scale reflects the number of nodes at the current state. Adjust the scale to required number of nodes.
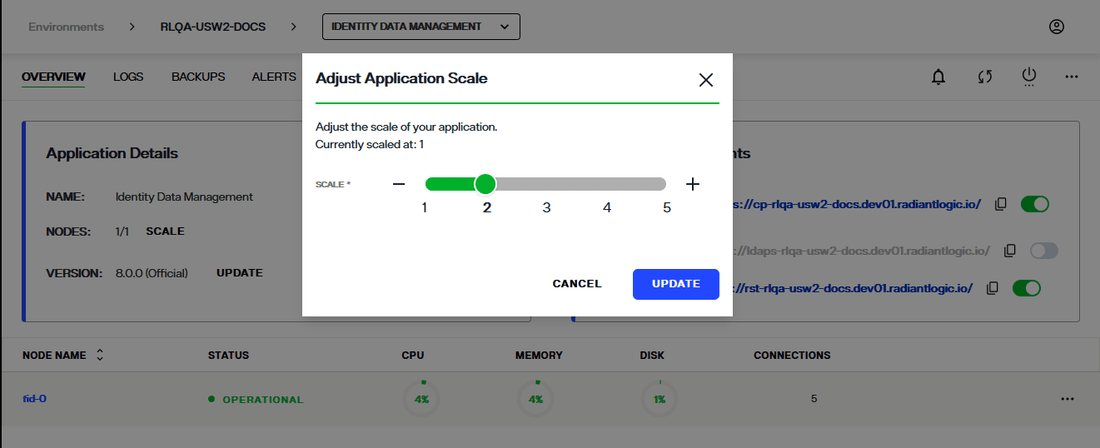
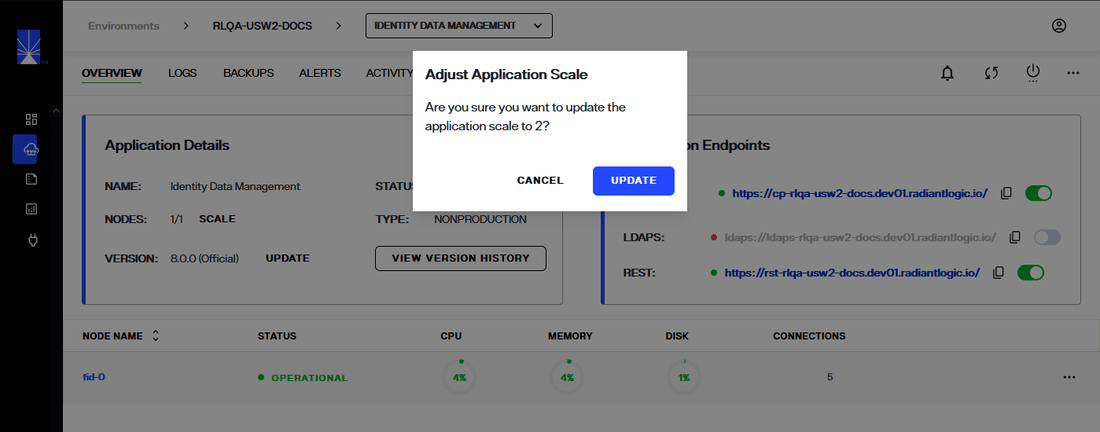
Click UPDATE to confirm your selection.
A message indicates that the environment scale is in process.
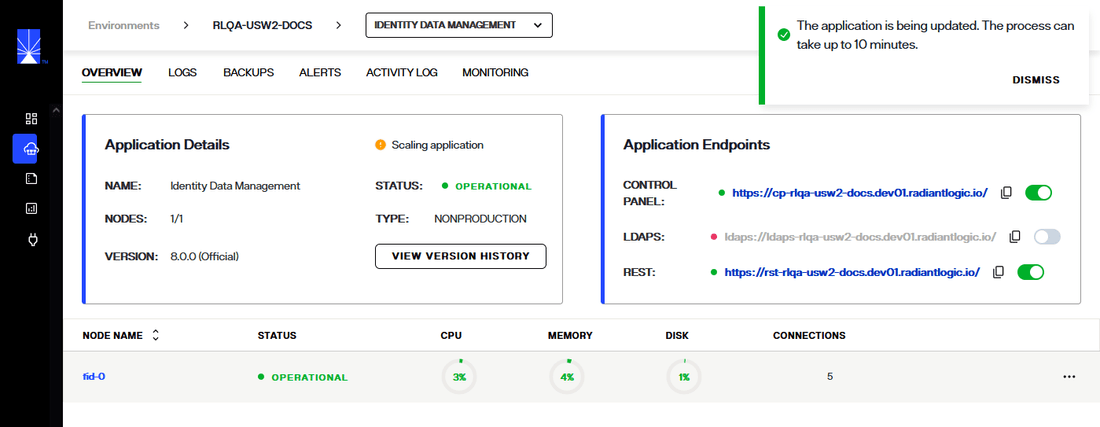
The number of nodes in the environment increases or decreases accordingly.
View node details
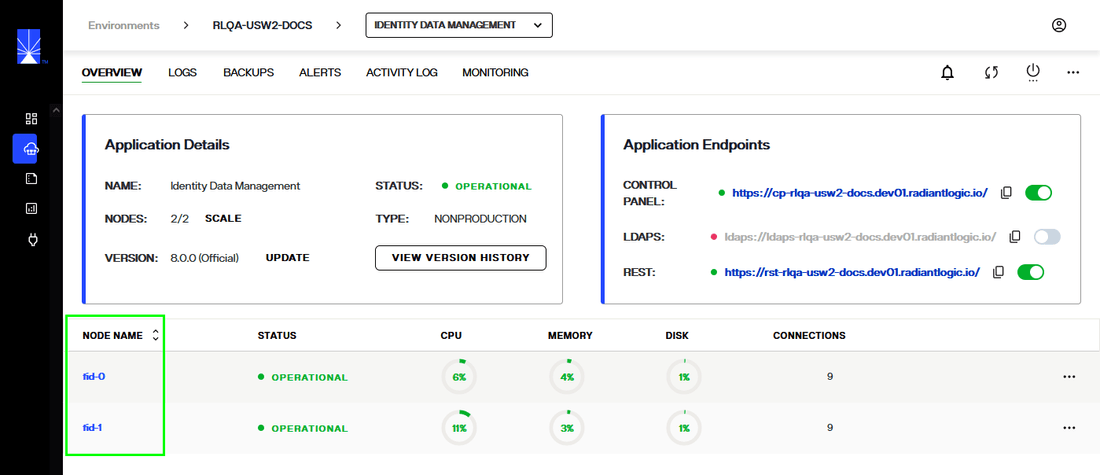
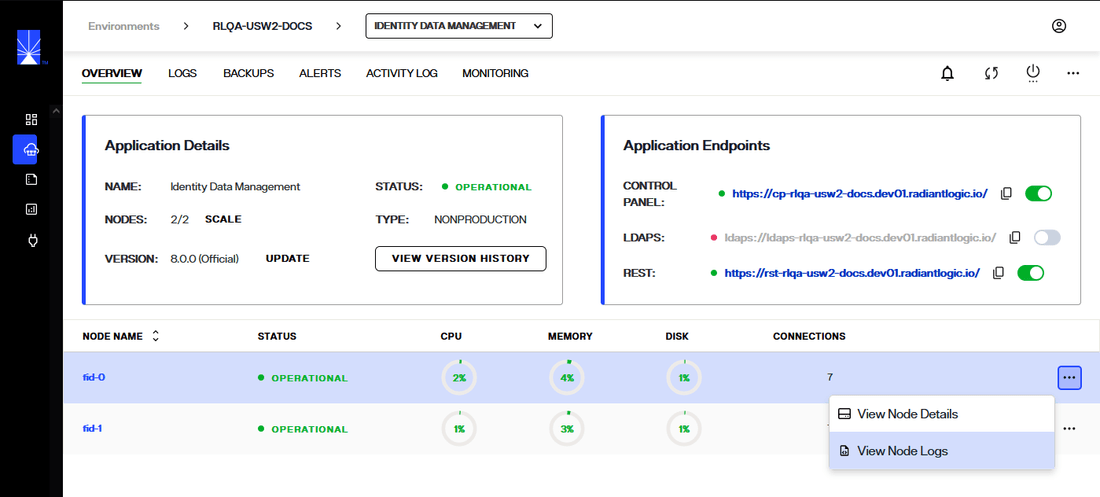
There are two ways to access the status details for a specific node: select the node name to open node details or select the Options(...) menu.
You can select the node name to open the node details dialog.
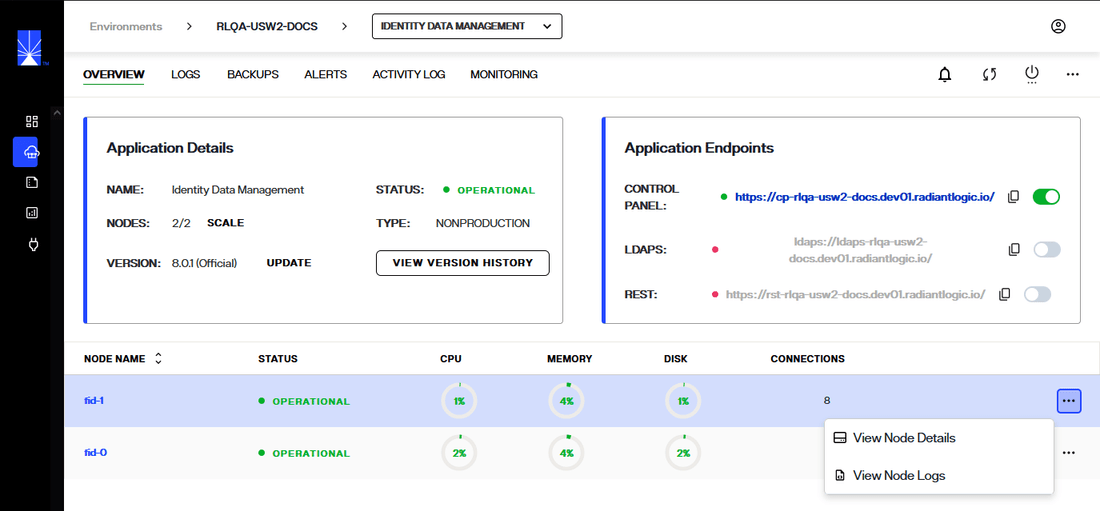
Alternatively, you can select the Options (...) menu located in the node row to expand the drop-down menu. From the Options menu select View Node Details to open the the node details dialog.
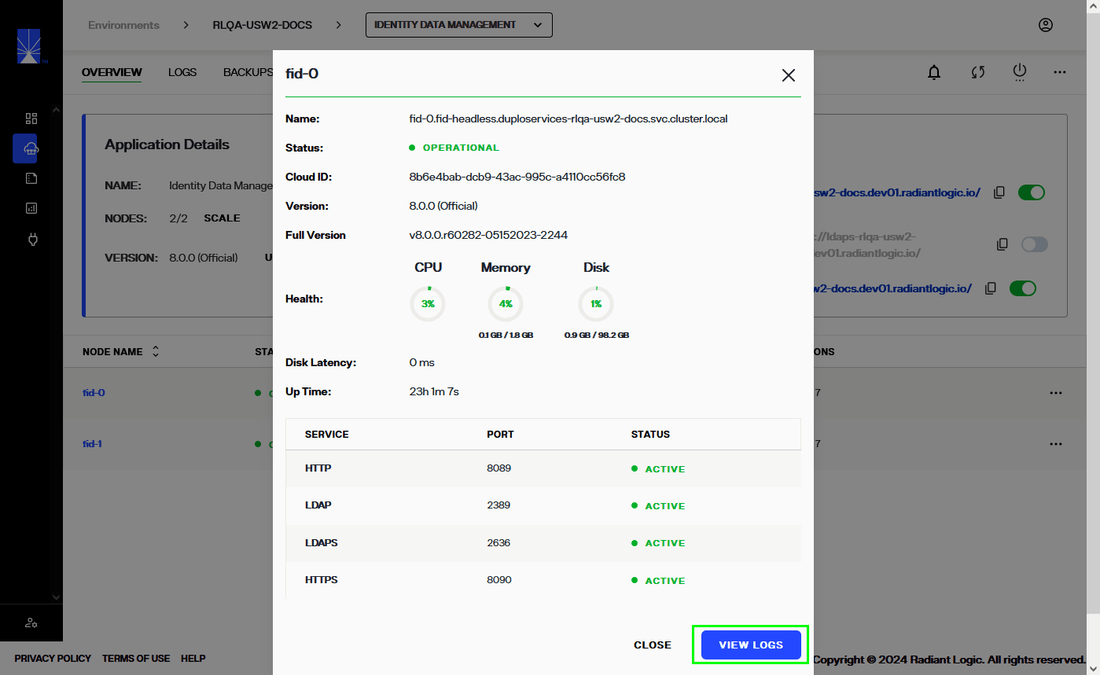
FID node details
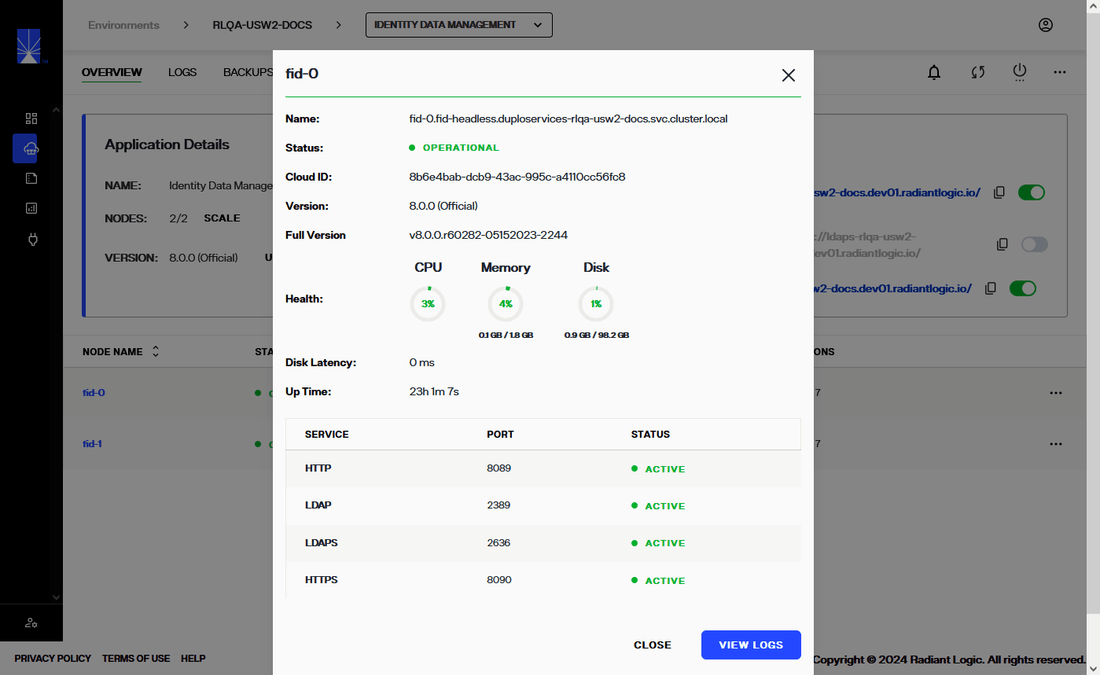
The FID node details dialog provides the following information for the selected node:
Node Details | Definition |
|---|---|
Name | The name assigned to the specific FID node. |
Status | Indicates if the node is operational, experiencing a partial outage, or experiencing a full outage. Displays as "Healthy", "Warning", or "Outage". |
Cloud ID | The unique ID of the node within the cluster of an environment. |
Version | The environment version number. |
Health | The status of the CPU and quantity used of memory and disk space. |
Disk Latency | The node performance. |
Up Time | How long the application has been running. |
Services | Lists the internal ports and their statuses. |
View node logs
Each node has associated log files that contain further information about the node's health and status alerts. The log files for a specific node can be accessed from the node details dialog or from the Options (...) drop-down of a node.
To access log files from a node's details dialog, select View Logs in the dialog.
Select Close to exit the node details dialog.
Alternatively, the log files of a node can be accessed by selecting View Logs from the associated Options (menu).
For further details on reviewing logs, see the environment logs guide.
Next steps
After reviewing this guide, you should have an understanding of how to review the status and health of specific FID nodes. For information on reviewing environment logs, see environment logs.