Alerts Overview
Alerts associated with activities monitored from the Control Panels are configured from the Main Control Panel > Settings tab > Monitoring section and are tied to the Task Scheduler which must be running. The status of the Task Scheduler can be seen on the Tasks tab in the Server Control Panel associated with the current leader node.
For alerts that leverage data collectors, it is important to note that some properties within data collectors require the RadiantOne service to be running to get status information. If you have configured custom alerts that use properties in a data collector that require the RadiantOne service to be running, andthe service stops, no alerts are sent. Be mindful of this when using data collectors in custom alerts.
RadiantOne offers standard alerts and custom alerts. Standard alerts cover the recommended minimum monitoring for the RadiantOne components and are pre-configured by default. Custom alerts allow you to define monitoring rules for all aspects of RadiantOne not addressed by a standard alert. Custom alerts are highly specialized and require services from Radiant Logic to setup. Please contact [email protected] for details.
Standard Alerts
For standard alerts, the default alert output is a file, but you can easily add email alerts to the configuration. When these alerts are activated, they are also displayed on the Main Control Panel’s Dashboard tab.
This section describes the aspects addressed by standard alerts.
RadiantOne Service Memory Usage
A file alert, when the RadiantOne service’s memory usage reaches 90%, is enabled by default. These settings can be changed from the Main Control Panel > Settings tab > Monitoring section > Standard Alerts. To change the memory threshold, slide the bar in the Memory section to the needed amount. Define the interval to check the memory (default is 120 seconds). The default alert output is File Alert, but if SMTP settings are configured in the Monitoring > Email Alert Settings section you can also use the Email Alert output. Click the Save button when you are finished making changes.
Connections to RadiantOne
A file alert, when the number of connections to RadiantOne reaches 800 is enabled by default. These settings can be changed from the Main Control Panel -> Settings tab -> Monitoring section -> Standard Alerts. To change the connection threshold, slide the bar in the Connections section to the needed amount. Define the interval to check the connections (default is 120 seconds). The default alert output is File Alert, but if SMTP settings are configured in the Monitoring -> Email Alert Settings section you can also use the Email Alert output. Click the Save button when you are finished making changes.
Data Source Availability
An alert can be triggered when the availability of a backend data source changes. If the data source has failover servers configured, the alert would only be triggered if all servers were unavailable (alert would be in a triggered state), or in a scenario where all servers were unavailable and then one or more of the servers comes back online (an alert would be issued indicating the availability is back to normal). The setting can be changed from the Main Control Panel > Settings tab > Monitoring section > Standard Alerts. Define the interval to check the data source availability (default is 120 seconds). The default alert output is File Alert, but if SMTP settings are configured in the Monitoring > Email Alert Settings section you can also use the Email Alert output. To enable alerts for data source availability, check the “Alert when a data source is disconnected” option and select the Data Sources to Monitor from the drop-down list. Click Save when you are finished.
Disk Usage
A file alert, when the disk usage on the RadiantOne machine reaches 90% of max capacity, is enabled by default. These settings can be changed from the Main Control Panel > Settings tab > Monitoring section > Standard Alerts. To change the disk usage, enter a threshold. Define the interval to check the data usage (default is 120 seconds). The default alert output is File Alert, but if SMTP settings are configured in the Monitoring > Email Alert Settings section you can also use the Email Alert output. Click the Save button when you are finished.
Closely monitoring disk space usage is extremely critical. If disk space is full, the RadiantOne service shuts down automatically.
Disk Latency
A file alert, when the disk latency on the RadiantOne machine reaches 100ms, is enabled by default. These settings can be changed from the Main Control Panel > Settings tab > Monitoring section > Standard Alerts. To change the disk latency, enter a threshold (in milliseconds). Define the interval to check the disk latency (default is 120 seconds). The default alert output is File Alert, but if SMTP settings are configured in the Monitoring > Email Alert Settings section you can also check the Email Alert output. Click the Save button when you are finished making changes.
Processing Load on RadiantOne
Alerts based on RadiantOne processing load are pre-configured, but not enabled by default. If you would like to receive an alert when the RadiantOne processing queues reach a certain threshold, from the Main Control Panel > Settings tab > Monitoring section > Standard Alerts, slide the bars for processing queues and internal queues to the threshold amount. Check the “Enable processing queues alerts” option. Click Save when you are finished.
Custom Alerts
Custom alerts allow you to define monitoring rules for all aspects of RadiantOne not addressed by a standard alert. The RadiantOne aspects that can be used in custom alerts are described in data collectors. Custom alerts are highly specialized and generally require services from Radiant Logic to setup. Please contact [email protected] for details. When these alerts are activated, they are also displayed on the Main Control Panel’s Dashboard tab.
All custom alerts defined appear on the Main Control Panel > Settings tab > Monitoring section > Custom Alerts section.
The “Enabled” column/status indicates if the alert is active.
RadiantOne Service Availability
The RadiantOne service should be monitored. A default custom alert named “VDS Running Check” is configured to monitor the state of the service. If RadiantOne is deployed in a cluster, the state of the service on all nodes is monitored. To view the alert, navigate to the Main Control Panel > Settings Tab > Monitoring > Custom Alerts (requires Expert Mode). Select the “VDS Running Check” alert and click Edit.
This custom alert leverages the isVdsRunning property of the node-monitor data collector to trigger a file alert if the RadiantOne service is not equal to true. If the value of the isVdsRunning property is false or N/A, an alert is triggered.
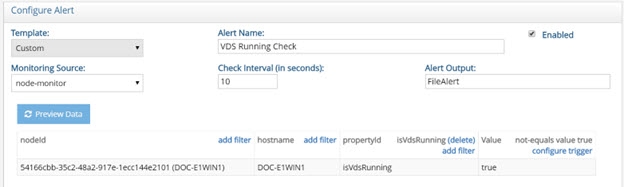
Figure 1: Default Alert for the RadiantOne Service Availability
If you have RadiantOne deployed in a cluster, you can monitor each service independently to have more granularity of alerts. For example, if one service stops in a cluster, the default “VDS Running Check” alert will be triggered. If another RadiantOne service in the cluster stops, no new alert is sent since the status is currently in a triggered state. Only when the RadiantOne service on all nodes is running again is a new alert sent to indicate the status of the services is back to normal. To be alerted about each RadiantOne service status change independently, configure custom alerts for each node. To do this, create a custom alert for each node, conditioning the alert by nodeId and/or hostname. The examples shown in the following screens describe a three-node cluster. The node IDs are used in the filters conditioning each custom alert.
Three custom alerts (shown below) can be used to monitor the RadiantOne service status on each cluster node. The isVdsRunning property name is case sensitive.
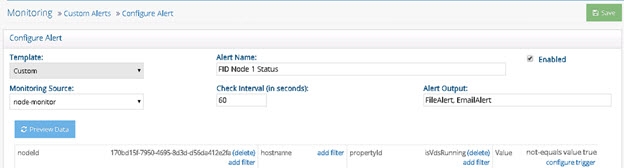
Figure 2: Custom Alert for RadiantOne Node 1
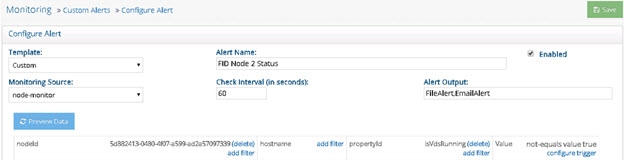
Figure 3: Custom Alert for RadiantOne Node 2
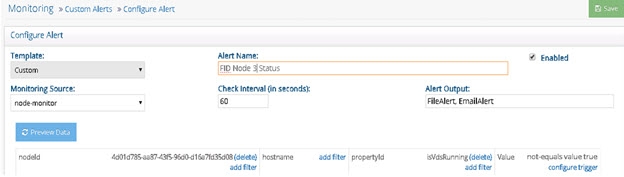
Figure 4: Custom Alert for RadiantOne Node 3
If all RadiantOne services are stopped, the alerts.log would contain something like the following, related to the three custom alerts described above:

2018 - 10 - 11 14:55:47 Alert FID Node 1 Status TRIGGERED

+--------------------------------------+------------+--------------+-------+
| nodeId | hostname | propertyId | value |
+--------------------------------------+------------+--------------+-------+
| 170bd15f- 7950 - 4695 - 8d3d-d56da412e2fa | DOC-E1WIN1 | isVdsRunning | false |
+--------------------------------------+------------+--------------+-------+
Instance: vds_server
Alert ID: ac726962-e75d- 4737 - 895a-79aeb887abbd
2018 - 10 - 11 14:55:53 Alert FID Node 2 Status TRIGGERED
+--------------------------------------+------------+--------------+-------+
| nodeId | hostname | propertyId | value |
+--------------------------------------+------------+--------------+-------+
| 5d882413- 0480 - 4f07-a599-ad2a57097339 | DOC-E1WIN2 | isVdsRunning | false |
+--------------------------------------+------------+--------------+-------+

Instance: vds_server
Alert ID: 5824631f-7b02-423e-be0b-0e5dabc7ca1e
2018 - 10 - 11 14:55:55 Alert FID Node 3 Status TRIGGERED
+--------------------------------------+------------+--------------+-------+
| nodeId | hostname | propertyId | value |
+--------------------------------------+------------+--------------+-------+
| 4d01d785-aa87-43f5-96d0-d16a7fd35d08 | DOC-E1WIN3 | isVdsRunning | false |
+--------------------------------------+------------+--------------+-------+
Instance: vds_server
Alert ID: 15abdac2- 7040 - 4792 - 99cf-3d81369507e3
The default “VDS Running Check” alert would return the following in the alerts log under the same condition of all services were down:
2018 - 10 - 11 14:55:20 Alert VDS Running Check TRIGGERED
+--------------------------------------+------------+--------------+-------+
| nodeId | hostname | propertyId | value |
+--------------------------------------+------------+--------------+-------+
| 170bd15f- 7950 - 4695 - 8d3d-d56da412e2fa | DOC-E1WIN1 | isVdsRunning | false |
| 4d01d785-aa87-43f5-96d0-d16a7fd35d08 | DOC-E1WIN3 | isVdsRunning | false |
| 5d882413- 0480 - 4f07-a599-ad2a57097339 | DOC-E1WIN2 | isVdsRunning | false |
+--------------------------------------+------------+--------------+-------+
Instance: vds_server
Alert ID: default_vds_running
If one of the RadiantOne services is restarted, an alert related to the corresponding custom alert is issued. An example of the alerts.log is shown below.
2018 - 10 - 11 15:00:44 Alert FID Node 1 Status BACK TO NORMAL
+--------------------------------------+------------+--------------+-------+
| nodeId | hostname | propertyId | value |
+--------------------------------------+------------+--------------+-------+
| 170bd15f- 7950 - 4695 - 8d3d-d56da412e2fa | DOC-E1WIN1 | isVdsRunning | true |
+--------------------------------------+------------+--------------+-------+
Instance: vds_server
Alert ID: ac726962-e75d- 4737 - 895a-79aeb887abbd
Whereas the default “VDS Running Check” alert would not send a new alert in this condition because based on the status of all conditions in the alert configuration, it is still considered “triggered” and the state hasn’t changed.
Persistent Cache Periodic Refresh Failure
To send an alert in the event of a persistent cache periodic refresh failure, configure a custom alert.
- Navigate to the Main Control Panel (of the current leader node if you have a cluster deployment) > Settings tab > Monitoring > Custom Alerts (requires Expert Mode).
- Select Custom from the Template drop-down menu.
- Select event-log from the Monitoring Source drop-down menu.
- Click Add Filter in the Event Type column, enter PCACHE for the value and click Add.
- Click Add Filter in the namingDn column. Enter the cached naming context that you want to monitor periodic refreshes for and click Add.
- Click Configure Trigger in the Value column.
- Select “equals” from the Trigger Type drop-down list and enter a value of WARN.
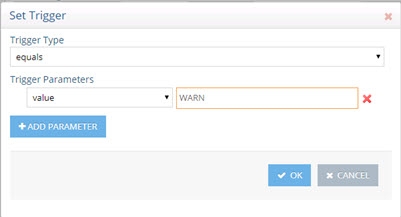
Figure 5: Configure Trigger for Custom Alert
-
Click OK.
-
If you want to only be alerted if the validation threshold has been exceeded, you can configure a Trigger with parameters above -1 like shown below instead of using (equals value WARN).
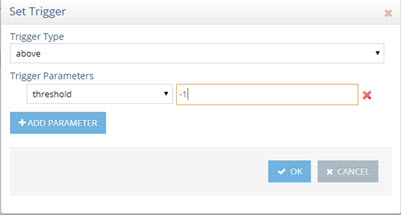
Figure 6: Configure Trigger for Custom Alert based on a Validation Threshold being Exceeded
-
Click Save.
When triggered, this alert displays on the Main Control Panel's Dashboard tab under Active Alerts as "ALERT: <alert_name>” and triggers a file alert. If SMTP settings are configured, email alerts can be triggered as well by adding EmailAlert to the Alert Output setting (click save if you modify the alert output).
ZooKeeper Write Failure
The ZooKeeper Write Check alert is enabled by default. This custom alert can be configured from the Main Control Panel (of the current leader node if you have a cluster deployment) > Settings Tab > Monitoring > Custom Alerts (requires Expert Mode). Select the ZooKeeper Write Check alert and click Edit.
This custom alert triggers a file alert if clients cannot write to ZooKeeper. If SMTP settings are configured, email alerts can be triggered as well by adding EmailAlert to the Alert Output setting (click Save if you modify the alert output).
Global Synchronization Capture Connector Stopped
To send an alert in the event of a global synchronization capture connector state change (e.g. a connector state changes from RUNNING to STOPPED), configure a custom alert.
- Navigate to the Main Control Panel (of the current leader node if you have a cluster deployment) > Settings tab > Monitoring > Custom Alerts (requires Expert Mode).
- Select Custom from the Template drop-down menu.
- Select pipeline from the Monitoring Source drop-down menu.
- Click Add Filter in the sourceDn column. Enter the naming context corresponding to the source DN in your global sync topology and click Add.
- Click Add Filter in the targetDn column. Enter the naming context corresponding to the target DN in your global sync topology and click Add.
- Click Add Filter in the pipelineType column. Enter SYNC for the value and click Add.
- Click Add Filter in the componentType column. Enter CAPTURE and click Add.
- Click Add Filter in the propertyId column. Enter captureState and click Add.
- Click Configure Trigger in the Value column.
- Select “not-equals” from the Trigger Type drop-down list and enter a value of RUNNING. This means that if the capture connector state is not equal to RUNNING, an alert gets triggered.
- Enter an Alert Name.
- Click Save.
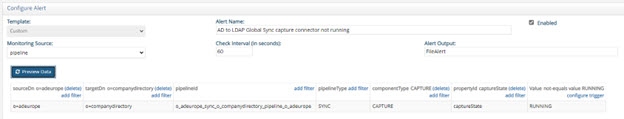
Figure 7: Custom Alert on Capture Connector
When triggered, this alert displays on the Main Control Panel's Dashboard tab under Active Alerts as "ALERT: <alert_name>” and triggers a file alert. If SMTP settings are configured, email alerts can be triggered as well by adding EmailAlert to the Alert Output setting (click save if you modify alert output).
Global Synchronization Queue Size
To send an alert in the event of a global synchronization queue growing, configure a custom alert.
-
Navigate to the Main Control Panel (of the current leader node if you have a cluster deployment) > Settings tab > Monitoring > Custom Alerts (requires Expert Mode).
-
Select Custom from the Template drop-down menu.
-
Select pipeline from the Monitoring Source drop-down menu.
-
Click Add Filter in the sourceDn column. Enter the naming context corresponding to the source DN in your global sync topology and click Add.
-
Click Add Filter in the targetDn column. Enter the naming context corresponding to the target DN in your global sync topology and click Add.
-
Click Add Filter in the pipelineType column. Enter SYNC for the value and click Add.
-
Click Add Filter in the propertyId column. Enter processorQueueSize and click Add.
-
Click Configure Trigger in the Value column.
-
Select “above” from the Trigger Type drop-down list and enter a threshold number indicating the number of events in the queue that should trigger the alert. In the example below, 50 is used. This means that if this queue contains more than 50 unprocessed events, an alert is triggered.
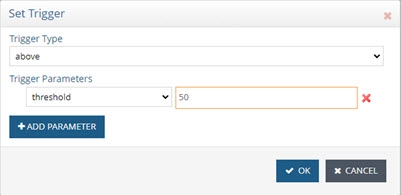
Figure 8: Configuring Alert Trigger
-
Enter an Alert Name.
-
Click Save.
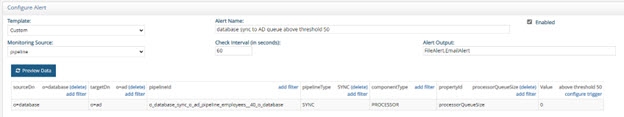
Figure 9: Custom Alert for Monitoring Global Sync Queue Size
-
When triggered, this alert displays on the Main Control Panel's Dashboard tab under Active Alerts as "ALERT: <alert_name>” and triggers a file alert. If SMTP settings are configured, email alerts can be triggered as well by adding EmailAlert to the Alert Output setting (click save if you modify alert output).
Configuration Changes
To configure alerts when configuration changes are made from the Main Control Panel > Settings tab or using the command line configuration utility (vdsconfig), configure the following custom alert.
-
Navigate to the Main Control Panel (of the current leader node if you have a cluster deployment) > Settings tab > Monitoring > Custom Alerts (requires Expert Mode).
-
Click Add.
-
Select Custom from the Template drop-down menu.
-
Select config-change from the Monitoring Source drop-down menu.
-
Click Configure Trigger in the Value column.
-
Select equals from the drop-down list and enter a value of true.
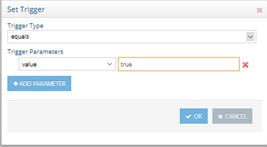
Figure 10: Setting Trigger Parameter (equals true)
-
Click OK.
-
Click Save.
-
When triggered, this alert displays on the Main Control Panel's Dashboard tab under Active Alerts as "ALERT: <alert_name>” and triggers a file alert. If SMTP settings are configured, email alerts can be triggered as well by adding EmailAlert to the Alert Output setting (click save if you modify alert output).
Email Alert Settings
If you would like to receive email alerts, configure the SMTP settings on the Main Control Panel (associated with the leader node if deployed in a cluster) > Settings Tab > Monitoring section > Email Alerts Settings. If SSL is not used, StartTLS with TLS v1.3 is used.
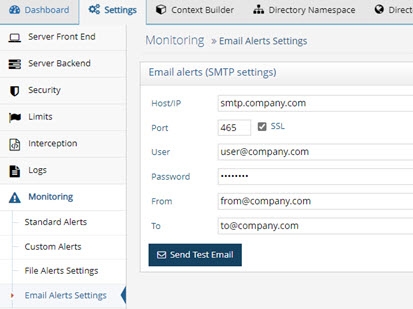
Figure 11: Email Alert Settings
To send alerts without credentials, leave the User and Password fields empty.
These properties are saved in Zookeeper at /radiantone/v1/cluster/config/monitoring.properties
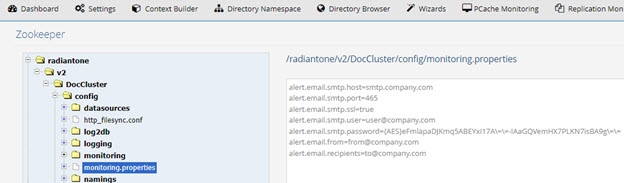
Figure 12: Email Settings in the Monitoring.properties
These settings can be reused in log4j logging configurations by using the following properties:
${rli:alert.email.recipients}
${rli:alert.email.from}
${rli:alert.email.protocol}
${rli:alert.email.smtp.host}
${rli:alert.email.smtp.port}
${rli:alert.email.smtp.user}
${rli:alert.email.smtp.password}
An example of using these properties in a log4j configuration is shown below for the log configuration of the scheduler.
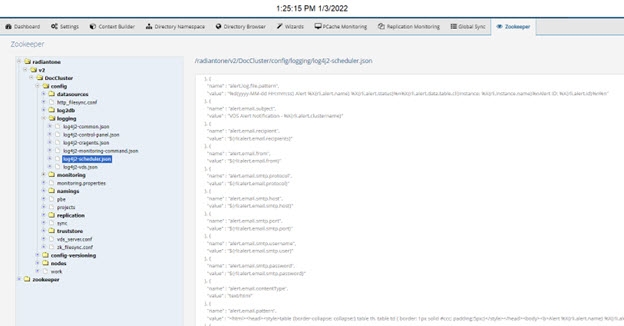
Figure 13: Example of Leveraging Email Alert Settings in Log4J Configurations
After SMTP settings are configured, to enable email alerts for standard alerts, check the Email Alert option and click Save.
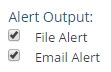
Figure 14: Standard Alert Output
To enable email alerts for custom alerts, enter a value of EmailAlert for the Alert Output setting and click Save.
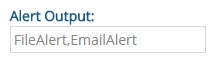
Figure 15: Custom Alert Output
Customizing the Email Message
By default, email alerts send an HTML-formatted email with the following pattern:
<html><head><style>table {border-collapse: collapse;} table th, table td { border: 1px solid #ccc; padding:5px;}</style></head><body><b>Alert %X{rli.alert.name}
%X{rli.alert.status}</b><br/>Server: %X{rli.node.hostname}<br/>Instance:
%X{rli.instance.name}<br/>%X{rli.alert.message}<br/>Collected
Data:<br/>%X{rli.alert.data.table.html}<br/>%d{yyyy-MM-dd HH:mm:ss}<br/>Alert ID:
%X{rli.alert.id}</body></html>
This pattern produces an email message that looks like the following:
------------------------------------
Alert Disk Usage above 90% TRIGGERED
Server: w-rli09-ben
Instance: vds_server
Collected Data:
nodeId
propertyId value 3124987d-63da-4bb7-9d88-9263664e9daf
diskPercent 96.19
2015 - 11 - 10 14:50:25
Alert ID: 00000000 - 0000 - 0000 - 0000 - 000000000002
------------------------------------
To customize the email message associated with email alerts:
- From the Zookeeper tab in the Main Control Panel navigate to
/radiantone/
/ /config/logging/log4j2-scheduler.json. - On the right, click Edit Mode.
- To customize the email subject, edit the alert.email.subject property and overwrite the default value.
- To customize the email content type, locate the property named: alert.email.contentType.
- Enter a value of text/plain or text/html (to send HTML emails).
- To customize the email message, locate the property named: alert.email.pattern.
- Enter the pattern that dictates the email message. In addition to the regular log4j2 pattern elements, the following properties are available by using %X{property}: rli.alert.id - example "00000000- 0000 - 0000 - 0000 - 000000000002" rli.alert.name - name of the monitoring alert (for example "Alert Disk Usage above 90%") rli.alert.status - "TRIGGERED" or "BACK TO NORMAL"
rli.node.hostname
rli.instance.name
rli.alert.data.table.cli - The data that has been polled in the form of a CLI table
rli.alert.data.table.html - The data that has been polled in the form of an HTML table (forHTML emails)
rli.alert.collector.id
rli.alert.collector.<parameter>
rli.alert.trigger
rli.alert.trigger.id
rli.alert.trigger.<parameter>
rli.alert.data.<prop1>.<prop2>...<propn> - allows you to fetch any value in the collected
data
The pattern can be as simple as:
%X{rli.alert.name} %X{rli.alert.status} at %d{yyyy-MM-dd HH:mm:ss}
Which produces an email message like:
Alert Disk Usage above 90% TRIGGERED at 2015- 11 - 10 14:50:25
File Alert Settings
File output is used for all pre-configured standard alerts. The alerts are logged in a CSV formatted file located at <RLI_HOME>/logs/alerts.log.
The default rollover size for the alert file is 100MB. The default number of log files to keep archived is 10. The default archive location and file name is: <RLI_HOME>/logs/alerts-
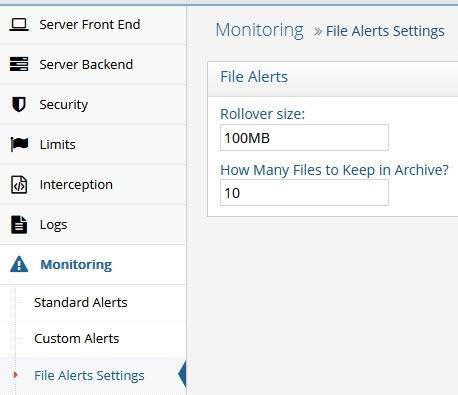
Figure 16: File Alerts Settings